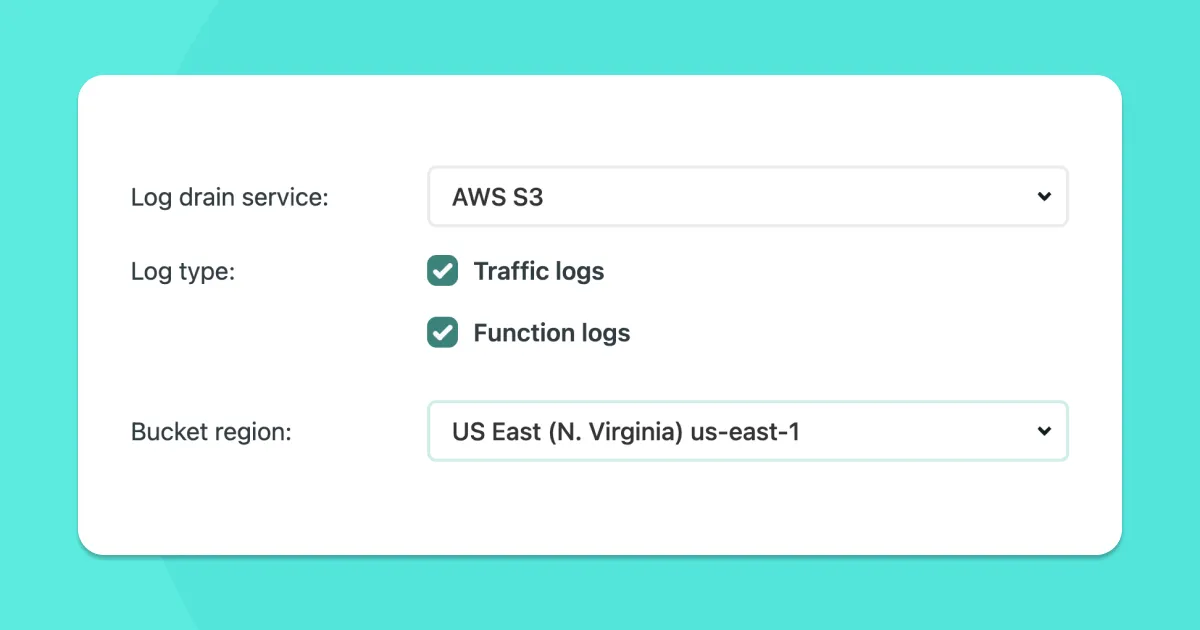
You can now export your traffic and functions logs from Netlify to New Relic with Log Drains!
Log Drains are available on Netlify’s Enterprise plans, and they allow you to send your Netlify log data to third-party destinations for storage, troubleshooting, and alerting beyond what’s possible with Netlify alone.
When you connect your Netlify site to New Relic with Log Drains, you can use New Relic’s Log Manager service to unlock advanced monitoring use cases, including:
- Near-real-time notifications and alerting
- User agent analytics and troubleshooting
- Session tracking to understand user activity and journeys across these sites
- Granular requests showing the HTTP 4xx and 5xx errors
- Serverless function invocation information and performance monitoring
- Detecting anomalies in visitor activity including traffic from bots and bad actors to enable security and compliance engineers to proactively defend their sites
- Need for longer log retention for month-over-month comparisons and cold storage
Get started with Log Drains for New Relic
To take advantage of Log Drains to New Relic, you’ll need an active New Relic account and a site deployed with Netlify.
If you don’t already have a New Relic account, you can sign up for free.
Before starting the configuration in Netlify, you’ll want to find your New Relic License key, also known as the INGEST-LICENSE key.
Here’s how to find it:
- Log in to your New Relic One account
- Click on the menu in the upper-right corner of the screen
- Select “API Keys”
- Locate your INGEST-LICENSE
- Click on the ellipses on the right side of the INGEST-LICENSE row Select “Copy key”
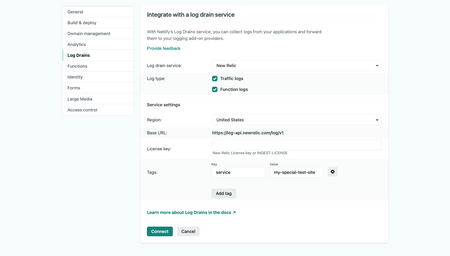
Next, log into Netlify and navigate to your Site Settings > Log Drains for the site you’d like to connect. Select New Relic, enter your INGEST-LICENSE key, and make any adjustments you’d like to the Tags. These Tags will be sent to New Relic as columns along with the Logs and may be helpful for reference or organization. When you’re done, click Connect!
Once your log drain is created, you will be able to find and filter your logs in the New Relic log manager.
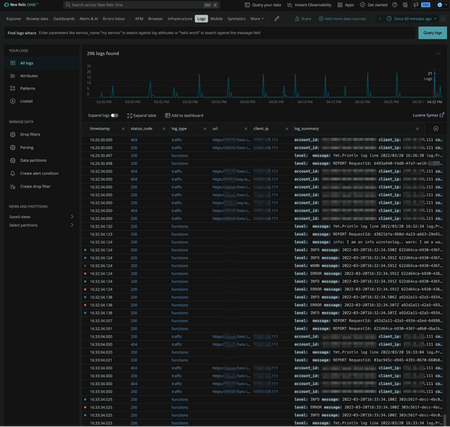
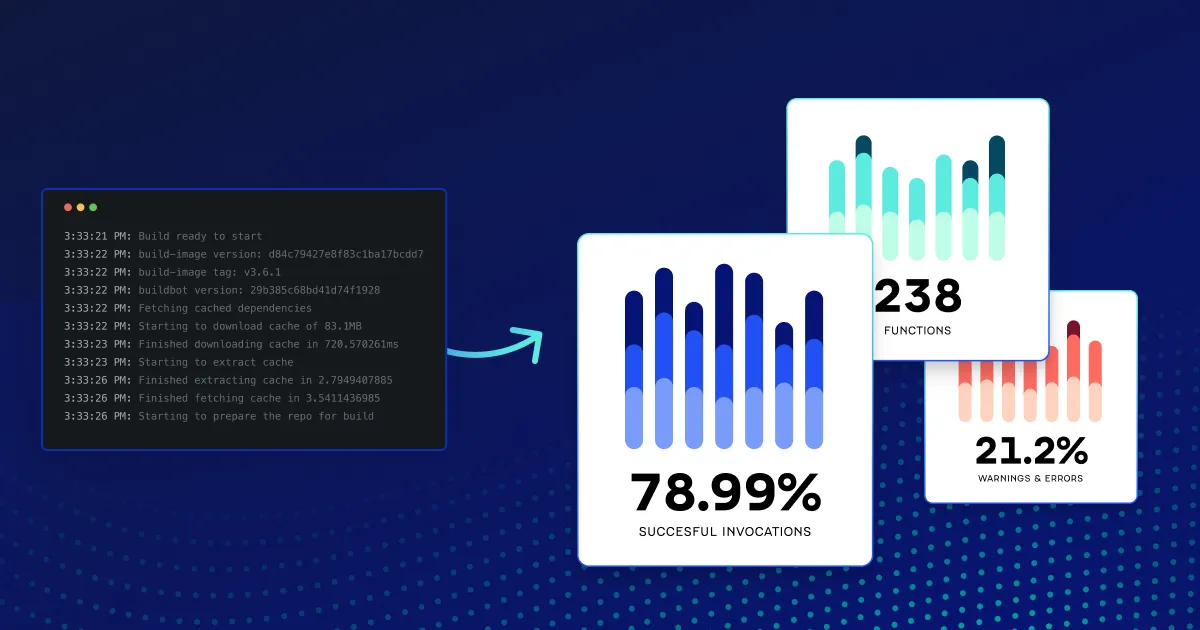
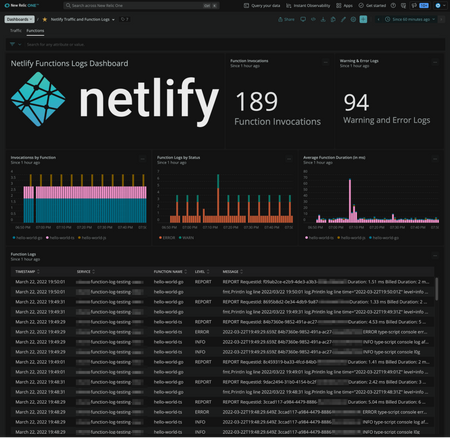
To make it even easier to parse your log data, you can install the Netlify Logs Quickstart in your New Relic account.
With this quickstart, you can easily understand:
- Changes in site traffic over time
- Percentage of successful requests, warnings, and errors
- Requests by status code
- Average duration of requests
- Changes in functions utilization over time
- Percentage of successful function invocations, warnings, and errors
- Number of function invocations by function name
- Average function duration
- Traffic logs and function logs for correlation with these metrics
What’s next
Expect to see updates to Netlify Log Drains coming soon! We’re currently evaluating additional destinations for integrations and considering the types of log formats required to make this data suitable for even more monitoring workflows.
Have a specific need for observability or application monitoring? We want to hear about it!
Please visit this post on the Netlify Forums and write back to let us know what you think.