What to expect from Google’s Core Web Vitals 2021 page experience update
When Google announces an update to their search engine ranking algorithm, there’s a corner of the SEO world who rings the alarm bells. Marketers and web developers panic. Can I keep my tracking scripts? Will the algorithm change affect my SERP? What is page experience, anyways? And seriously, what do I do about my tracking scripts?
Given Google’s 91% of search market share, these are valid concerns. But the recent updates to Core Web Vitals, which roll out in June 2021, are actually great news for developers, SEO strategists, and users alike.
The 2021 updates prioritize the quality of a user’s experience on your site, and rank search results accordingly. Google is very explicit about which metrics they use to quantify a user experience: Largest Contentful Paint (LCP), First Input Delay (FID), and Cumulative Layout Shift (CLS). This gives anyone involved in technical SEO quantifiable metrics to work towards. Even better? Google’s open source tools offer specific suggestions for how to improve our sites to both rank higher, and make for a better user experience.
In this post, we’ll go over the three pillars of Core Web Vitals, and explore some common fixes that improve page experience.
👉 Get the Guide: How to Boost Site Performance with the Jamstack
Intro to Core Web Vitals
Google has been using metrics like this to proxy user experience for a long time. In 2010, they first explained how they used site speed to rank search results. But the web has evolved a lot in the 11 years since that announcement. As browsers become more powerful, user expectations about interactivity, availability, and security have also risen.
With Google’s 2021 update, Core Web Vitals has three pillars: speed, responsiveness, and visual stability. This is just a subset of a larger group of Web Vitals, which also take security, mobile-readiness, and more into account.

Specifically, Core Web Vitals examines how fast the biggest piece of content in the initial viewport loads (loading), how responsive a page is (interactivity), and how jumpy a page is (visual stability). Each pillar is attached to one metric. The three metrics that make up the Core Web Vitals are Largest Contentful Paint, First Input Delay, and Cumulative Layout Shift.
Ready to get into the alphabet soup of LCP, FID, and CLS? Let’s do it.
Largest Contentful Paint (LCP)
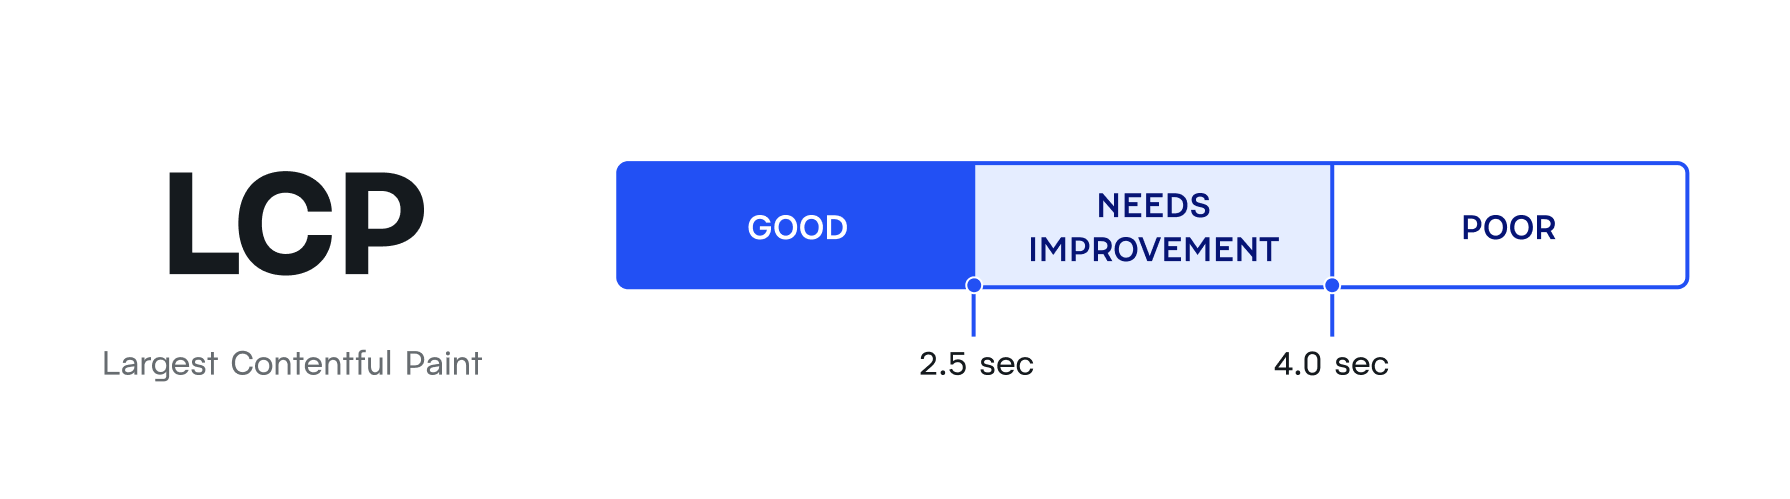
Largest Contentful Paint measures perceived load speed. Again, measuring load speed is nothing new. What’s new is the way Google measures perception of load speed. Historically, they’ve recommended metrics like Speed Index (SI)—the average time at which visible parts of the page are displayed, or First Meaningful Paint (FMP)—the time between the user initiating the page load and the page rendering the primary above-the-fold content. Largest Contentful Paint measures how long it takes to render the largest single element in the viewport.
Largest Contentful Paint reports the render time of the largest element within the viewport, relative to when the page first started loading.
It’s a nuanced difference between previous iterations, but an important one. Essentially, what LCP asks of your site is, “How long does the single largest element on your page take to show up?”
So, why the change? Based on discussions in the W3C Web Performance Working Group and internal research done at the company, Google found that measuring LCP instead of FMP is a more accurate way to measure when users perceive the “main content” of a page to be useful.
For more on what kinds of elements are considered, and how element size is calculated, you can check out the LCP API.
How to Improve Low LCP Scores
A good LCP score, in Google’s book, is less than 2.5 seconds.
Long LCP times tend to happen for the following reasons:
- Slow server response times
- Render-blocking JavaScript and CSS on the app
- Slow resource load times
- Client-side rendering
The best way to improve LCP is to find the largest element in your viewport and figure out how to render it faster. This might mean optimizing and compressing images or content files, preloading important resources, using a CDN, or inlining certain assets. Starting with a Jamstack architecture can help with a lot of these, since all content is prebuilt for performance and deployed directly to a global edge network.
📖 Case Study: Learn how Pan MacMillan improved SEO rankings and performance by migrating to Netlify
First Input Delay (FID)
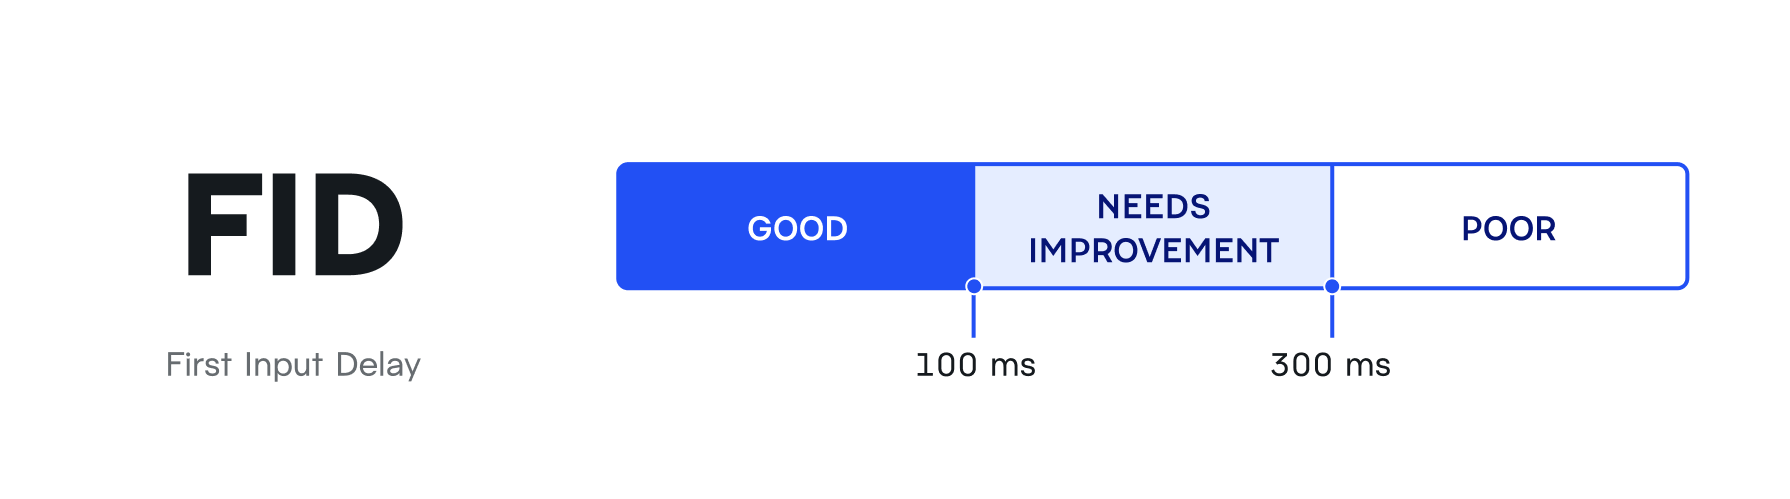
First Input Delay measures a site’s perceived interactivity. The lower the delay time, the better. Specifically FID, it attempts to put a number behind how a user might feel when trying to interact with unresponsive pages. A low FID time indicates to Google search that your site is responsive to a user’s actions.
So. How exactly is that calculated? FID is expressed in milliseconds, and is the delta between the time when a user first interacts with your site (for example, they click on a link or tap on a button) to the time when the browser actually responds to that request.
FID reports the time between when a user first interacts with your site and the time when your site responds.
What causes Low FID scores?
To provide a good user experience, pages should have a FID of less than 100 ms.
There’s basically one culprit for high FID load times: heavy client-side JavaScript execution.
How do you fix high FID load times? Try only loading the bare minimum of what is required to load the page and then let users interact with them. For instance, you might delay third-party scripts and tags until the initial content is loaded.
Here’s some more advice from Google on how to reduce FID:
- Reduce the impact of third-party code
- Reduce JavaScript execution time
- Minimize main thread work
- Keep request counts low and transfer sizes small
Note: FID is a field metric, not a lab metric. This means it’s measured in real life, by real users, and can’t be replicated in lab settings (i.e., the conditions produced by testing suites. This means it won’t appear in your Lighthouse score calculations, or similar synthetic monitoring tools. For a proxy metric, Google recommends using TBT (total blocking time).
Cumulative Layout Shift (CLS)
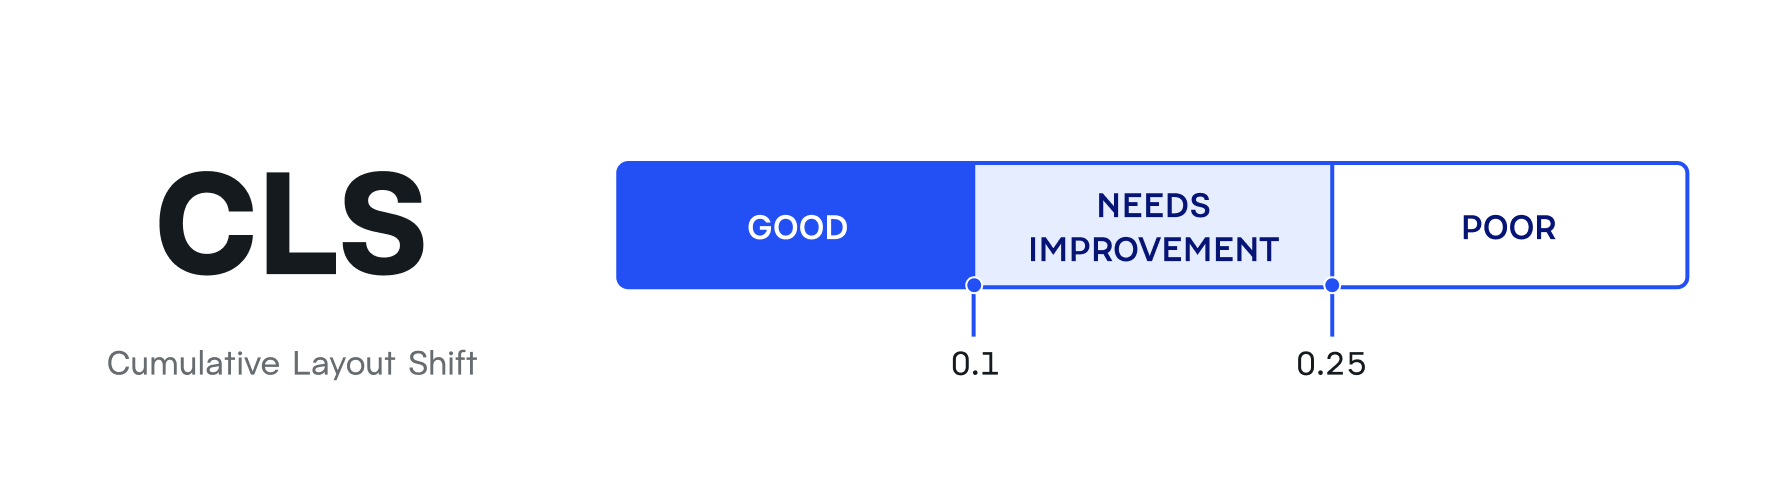
CLS measures the visual stability of a page. Users expect page content to move around when interacting with your site. But when content shifts without a user expecting it, that can make for a bad experience. Even worse, they can lead to users clicking the wrong buttons, or even placing orders they didn’t want.
How is CLS calculated? It’s a scale created by Google that measures how much your content moves around after the initial page load, and layout shifts are defined by the Layout Instability API.
CLS records the lifespan of a page loading, and reports the largest “burst” of a layout shift scores in that lifespan.
What Causes Low CLS scores?
To provide a good user experience, pages should maintain a CLS of less than 0.1.
Most websites can avoid unexpected layout shifts by sticking to a few guiding principles, as indicated by Google:
- Include sizing attributes on images and video elements
- Don’t insert content above existing content unless it’s in response to a user interaction
- Animate transitions in a way that provides context and continuity between states.
Cumulative Layout Shift is perhaps the hardest Core Web Vital to quickly improve upon. While LCP and FID have one or two main issues to focus on, CLS consists of lots of small things, and following the above guiding principles whenever deploying new pages or sites.
How do I measure my Core Web Vitals?
There are a lot of different ways to measure Core Web Vitals. It’s important to note that some of these tools use lab metrics (measured in reproductible settings, by a computer), and some are field metrics (measured by real users). As noted, FID is not lab-reproducible, so some of the tools below don’t measure it, but measure TBT (total blocking time) instead.

Even within tools like Lighthouse, there can be different ways to run tests. Lighthouse tests can be run from Chrome DevTools, from the web UI, or your command line. You can also run it as a Node module to integrate Lighthouse into your CI systems.
With the Netlify Lighthouse plugin, you don’t have to make an extra trip to the command line or Lighthouse UI. Netlify will automatically generate a Lighthouse report for every deploy.
If you’re using Netlify for improved site performance, this plugin is an easy way to regularly monitor the metrics that matter to your team, and ensure your performance doesn’t degrade over time. And if you see your Lighthouse scores degrade after a deploy, Netlify makes it easy to instantly roll back to a previous, more performant version of your site.
How to Improve Core Web Vitals
Core Web Vitals can be improved by working on a lot of different aspects of a site, starting from the infrastructure it’s hosted on, to the way the app is built, to making small tweaks like resizing individual images.
Here are some of the highest-impact ways to improve CWV:
- Enable compression by default
- Minify CSS, JS, and HTML
- Reduce the number of redirects
- Remove render-blocking JavaScript
- Cache assets at the edge with a CDN or Netlify Edge
- Serve static assets with an efficient cache policy
- Avoid an excessive DOM size
- Avoid enormous network payloads
Adopting Jamstack on Netlify and implementing best practices lays a strong foundation for performance, and high Core Web Vital scores. Much of this is enabled by default on Netlify. For example, assets delivered by Netlify Edge are automatically compressed with Brotli encoding for even smaller sizes and decompression efficiency. Netlify Edge is distributed just like a CDN, but with advanced functionality for publishing entire sites and applications. Its global distribution with automated prerendering makes for blazing fast site delivery. Even higher scores are achieved with Netlify’s HP Edge, available on Enterprise plans, a network with 30% faster speeds than our standard edge.
👉 Get the Guide: How to Boost Site Performance with the Jamstack and Netlify Enterprise
There’s no one tool teams can adopt to achieve perfect Core Web Vitals. But by adopting Jamstack on Netlify and implementing best practices, you’ll be well-equipped to build performant sites that rank well in Google search and better serve your users.