Throughout December we’ll be highlighting a different Netlify feature each day. It might just be the thing you need to unlock those creative juices, and dust off that domain you registered but never deployed! Keep an eye on the blog and on Twitter for each feature!
A good way to inform decisions about what you’re building is with data. What better way to do this than with Netlify Analytics!
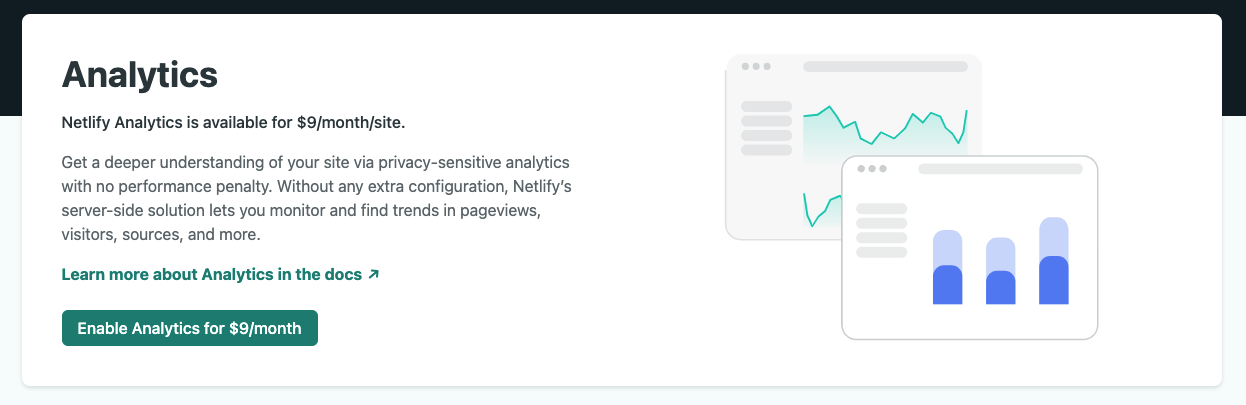
Through our Analytics feature, you can monitor trends in your sites’ activity with metrics such as pageviews, unique visitors, top locations, top sources and pages, and more!
To enable it, navigate to the Analytics tab on your site and click on Enable Analytics.
Data is collected when your site is first deployed, even if you did not enable Analytics, so you should see some data in the different charts as soon as you enable the feature!
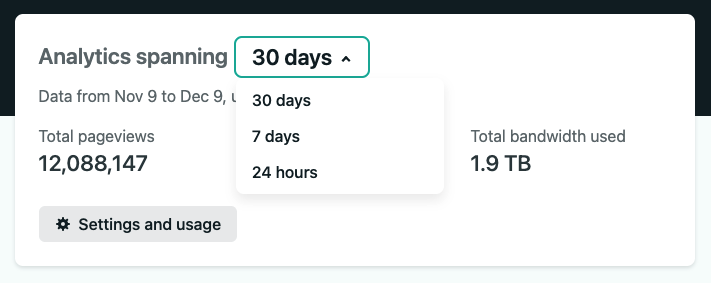
By default, the charts show data for the past 30 days, and you can switch between different time periods by using the filters in the header card.
You can enable or disable this feature on any of your site, at any time!